I discovered the Chrome DevTools MCP server from a Google Chrome Developers YouTube video. The idea was intriguing: connect Claude Code directly to my browser via Chrome’s remote debugging protocol.
Installation
Installing it in Claude Code CLI was straightforward. I added this simple configuration:
{
  "mcpServers": {
    "chrome-devtools": {
      "command": "npx",
      "enabled": false,
      "args": [
        "chrome-devtools-mcp@latest"
      ]
    }
  }
}
I kept it disabled by default for reasons I’ll explain below.
Getting It to Work
The --auto-connect feature didn’t work for me—connection would fail silently. After removing that flag and launching a dedicated Chrome instance with remote debugging, it worked:
/Applications/Google\ Chrome.app/Contents/MacOS/Google\ Chrome \
  --remote-debugging-port=9222 \
  --user-data-dir=/tmp/chrome-mcp-profile
Using a separate user data directory has a nice side effect: you can log into Google accounts or any websites, and the sessions persist. Pretty convenient.
The Token Cost
After just a few queries involving page navigation and screenshots, I burned through approximately 5 million tokens. The MCP pipes full DOM trees, computed styles, and metadata into the context window. It’s powerful, but expensive.
My Take
I’m using Fireworks AI with their Firepass plan which helps with the usage. My recommendation: only enable it when you need it, not as a default. A few queries and the token count stacks up fast.
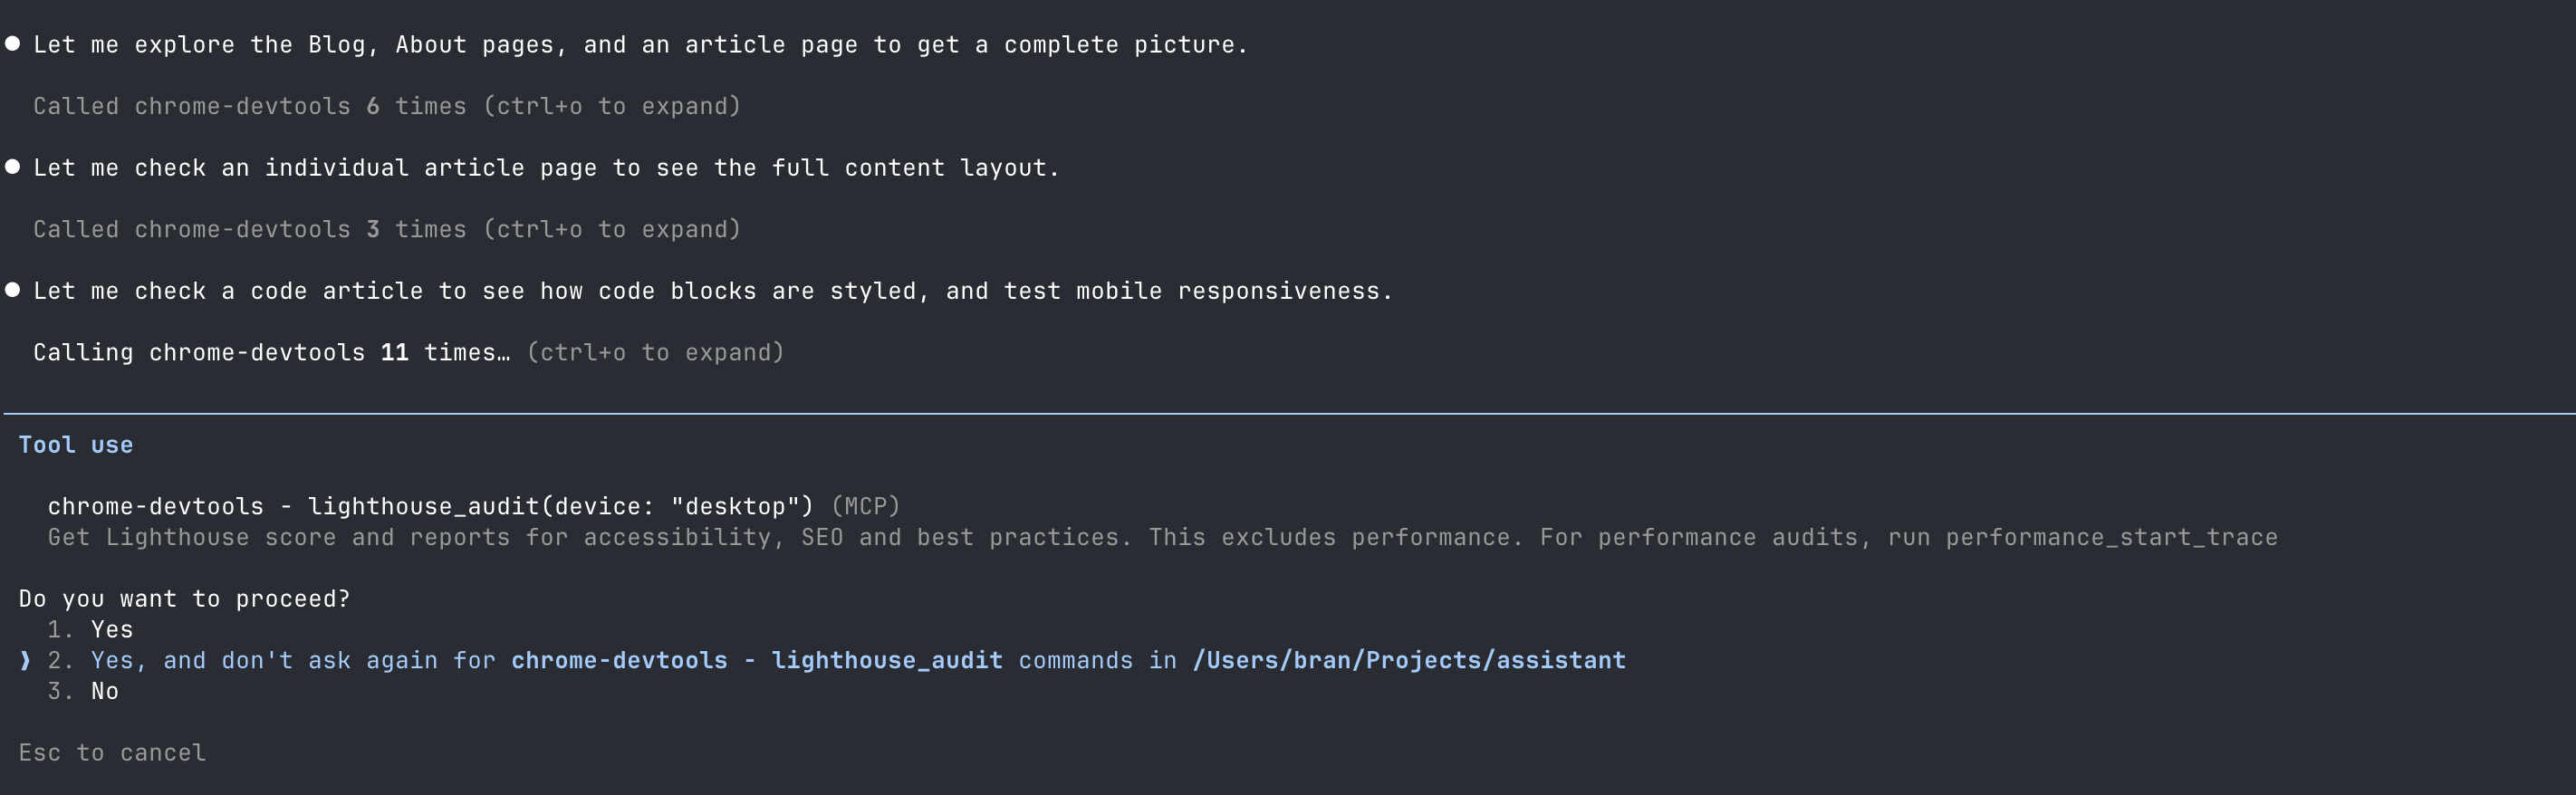
Terminal Session
Here’s what it looks like in practice:
Bottom Line
It’s genuinely useful having an AI assistant that can “look” at your screen and debug live web pages. Just remember to disable it when you’re done—your token budget will thank you.